
Gold and Silver
What Do the Charts Say?
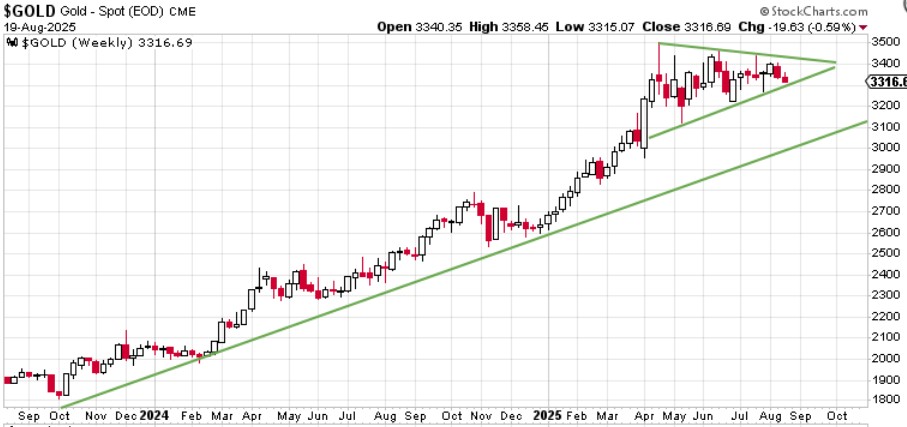
The gold chart over the last few months has been rather subdued after racing to a new all-time high in April. Since then, it has carved out a wedge pattern. Traditionally, if the wedge is rising, the price often breaks down and retests support. When the wedge is falling, the opposite happens, and the price breaks out to the upside and reaches new intermediate or all-time highs.
This particular wedge is slightly rising. The price could go either way, with a slight bias to the downside. If that were to occur, it would indicate a possible test of the rising, two-year trendline. With a possible peace agreement between Ukraine and Russia, this scenario could play out. However, another major factor in determining the direction of gold prices is the looming symposium in Jackson Hole, Wyoming. This annual event is closely watched for clues as to the direction of interest rates in the coming months.
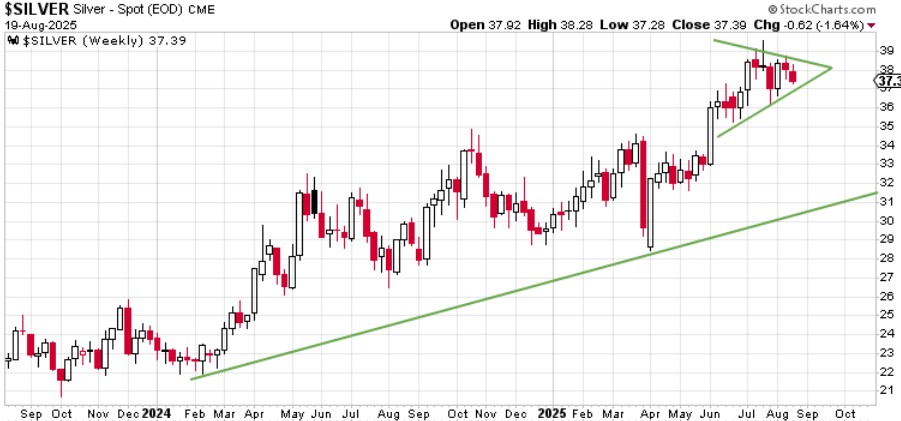
In our last newsletter, we said that if silver broke out, it could quickly reach $40. Sure enough, silver rose above $39 for the first time in over thirteen years. This is a very good sign that silver is finally ready to stop lagging behind the percentage rise in the price of gold. If gold does indeed retest the upward trend line, we could see silver do the same. What a potential buying opportunity that would be. As both gold and silver continue to rise in the coming years, we could see gains in silver significantly outperform the yellow metal.
We will soon know which way this story is going to unfold.