
Regardless of all the craziness in the world, this is the time of year that everyone tends to step back and focus on family, friends, and faith. Christmas has traditionally been a time when differences get put aside and civility rules. It is our genuine hope that you and your families will be able to rest in the peace and love that the Holiday season brings.
With that said, the world marches on. The geopolitical and economic transitions we are experiencing don’t take time off. The world is a complex place. The issues driving us into the future are getting more complex by the week. That reality is reflected in the gold and silver markets. What a couple of months it’s been! As always, we’re here to do our part to provide some insight on where it’s been and where it may be going. In the midst of it all…
Have a wonderful Christmas,
The OWNx Team
Gold and Silver
What Do the Charts Say?
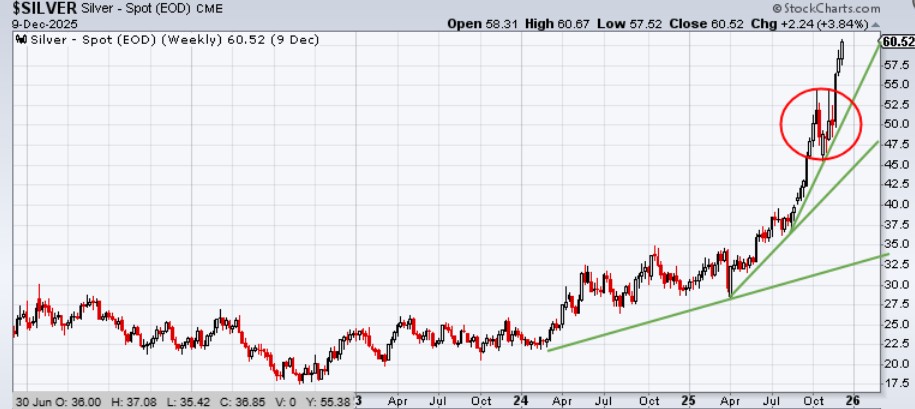
For the last two years, we’ve watched gold relentlessly march to all-time highs. Those buying and holding silver wondered if they’d invested in the wrong metal. Now, the story has decidedly shifted. Silver has done what we said it would do. At some point, it would stop sleeping and take on a life of its own. While gold “marched” to all-time highs, silver has exploded. In fact, it is presently setting new highs each week. Some of this has to do with the gold-silver ratio being out of balance for some time. However, that is a small part of the story. Silver supplies are very tight, and the location of physical silver stockpiles has been out of balance globally. Add to that the realization that AI is advancing more rapidly than first forecast, and that computing demand to support it will consume a LOT of silver, and you can understand why the chart looks like it does.
So, what does the chart say? When a chart breaks out like this to new all-time highs, there isn’t much in terms of existing long-term patterns and resistance points that you can rely on. Thus, as we examine the five-year chart, we are now looking for trendlines and areas of support when the price eventually pulls back. At the moment, there are three trend lines that have emerged. With the market dynamics being as they are, it’s unlikely the lower trend line will be relevant for some time, if ever. The top trendline is unsustainable over any length of time. Thus, the middle trend-line is what we see as most likely to be in play for the next few months at least. The congestion level in the previous all-time high around $50 per ounce should hold as support in any pullback in the next few months. Time will tell. One thing that seems evident is that the white metal will not be looked at the same way again.
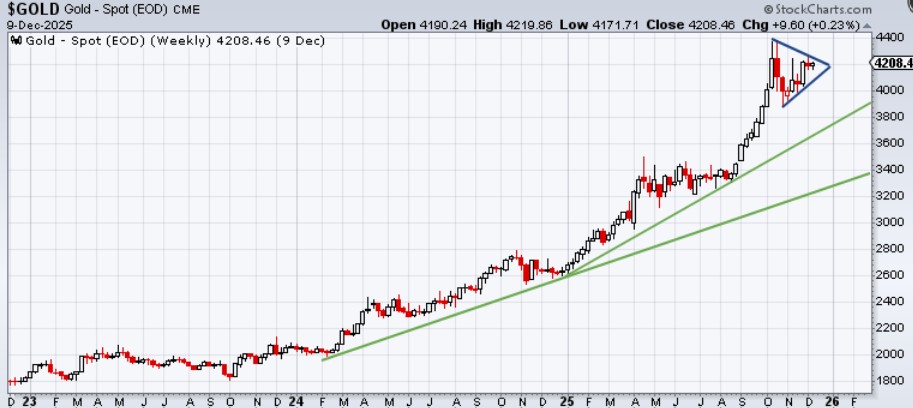
Now, let’s turn to the gold chart. It has been quietly putting in a wedge pattern. This could be an extended pattern, and if it should break downward upon exiting it, we would expect support to be at the second trend line to begin. Very strong long-term support lies in that $3,400 range. Should gold reach here again, it would likely be a very good entry point for long-term investors.
OWNx EDGE
In case you missed the earlier announcements, we want to make you aware of an exciting new opportunity for our clients. For over fifteen years, our quest has been to disrupt how precious metals are made available in the market. We believe everyone, regardless of how much metal they are able to purchase, should be able to easily buy it at the lowest possible cost. With the new OWNx EDGE membership, you can now purchase all your stored metal at wholesale cost. That means…
- 0% premiums!
- You get your metal at nearly the same price as those who buy millions of dollars of metal.
Whether it is innovation in Precious Metal’s IRAs or buying metal at cost, we continue to level the playing field for our clients.